
Table of Contents
- Access Dashboard Data
- AI Detection Summary
- Analyze Categories
- Review Top Blocked and Most Popular Sites
- Investigate Top Blocked Students
- Best Practices
Audience: Administrators
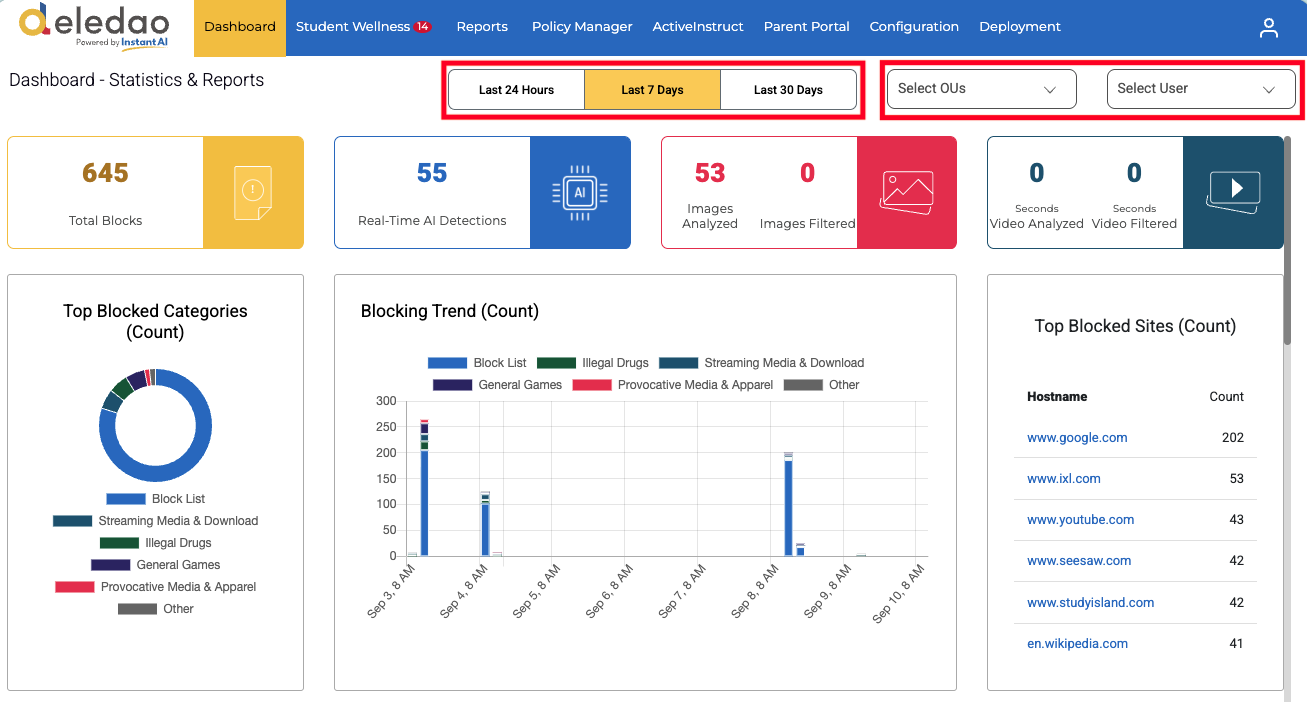
The Dashboard provides a high-level view of web activity across your organization. Use it to monitor browsing trends, identify frequently blocked content, review popular websites, and quickly access detailed reports. The dashboard can display data for the last 24 hours, 7 days, or 30 days, and can be filtered by Organizational Unit (OU).
Access Dashboard Data
The Dashboard displays browser activity statistics for users across your organization. To focus your analysis, you can:
- View activity from the last 24 hours
- View activity from the last 7 days
- View activity from the last 30 days
- Filter results by a specific Organizational Unit (OU) or User
These filters help you quickly identify trends at the district, school, OU, or user level.
AI Detection Summary
The summary of AI analysis during the specified time frame includes statistics of the analysis of Images and Videos.

Analyze Categories
The Dashboard includes interactive visual charts that allow you to drill down into specific browsing and filtering categories.
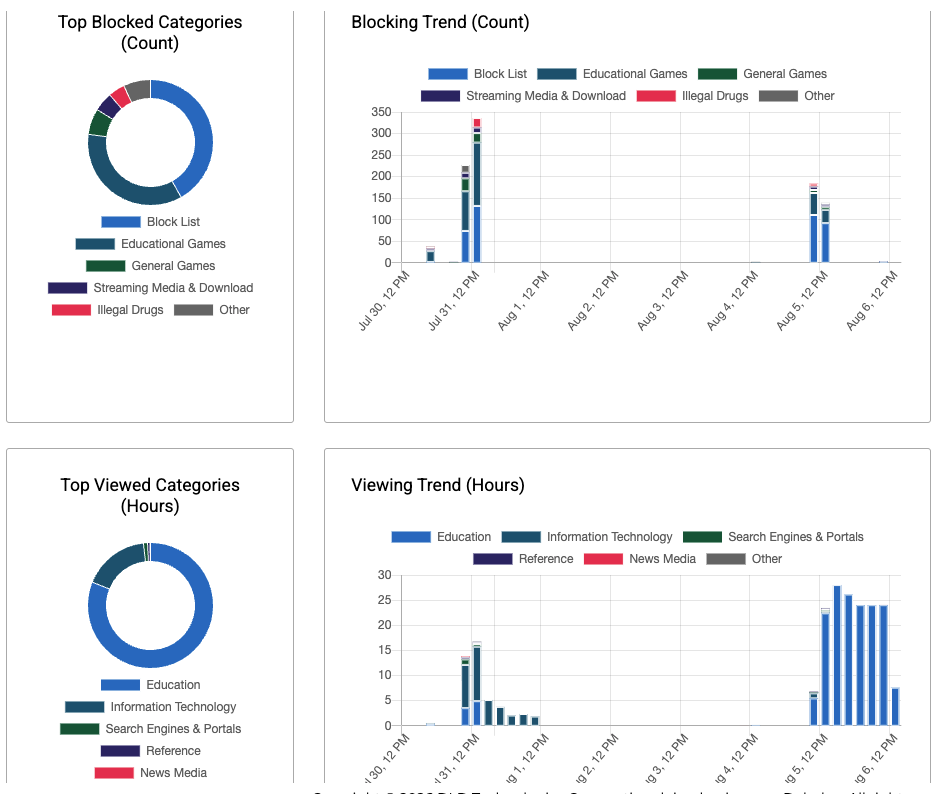
Top Block Categories (Count)
Select a category in the Top Block Categories chart to view a detailed report of websites that were blocked within that category.
Top Viewed Categories (Hours)
Select a category in the Top Viewed Categories chart to view websites that users have accessed within that category.
Blocking Trend (Count)
Click a category within the Blocking Trend bar chart to open a report showing websites associated with that category.
Viewing Trend (Hours)
Click a category within the Viewing Trend bar chart to review websites visited within that category.
Review Top Blocked and Most Popular Sites
The Dashboard provides quick access to frequently visited and frequently blocked websites.
Top Blocked Sites
The Top Blocked Sites widget displays websites that have generated the most filtering activity. Clicking a URL under the Hostname column opens the website directly in a new browser tab.
Most Popular Sites
The Most Popular Sites widget displays websites that users visit most frequently. Clicking a URL under the Hostname column opens the website directly in a new browser tab.
Investigate Top Blocked Students
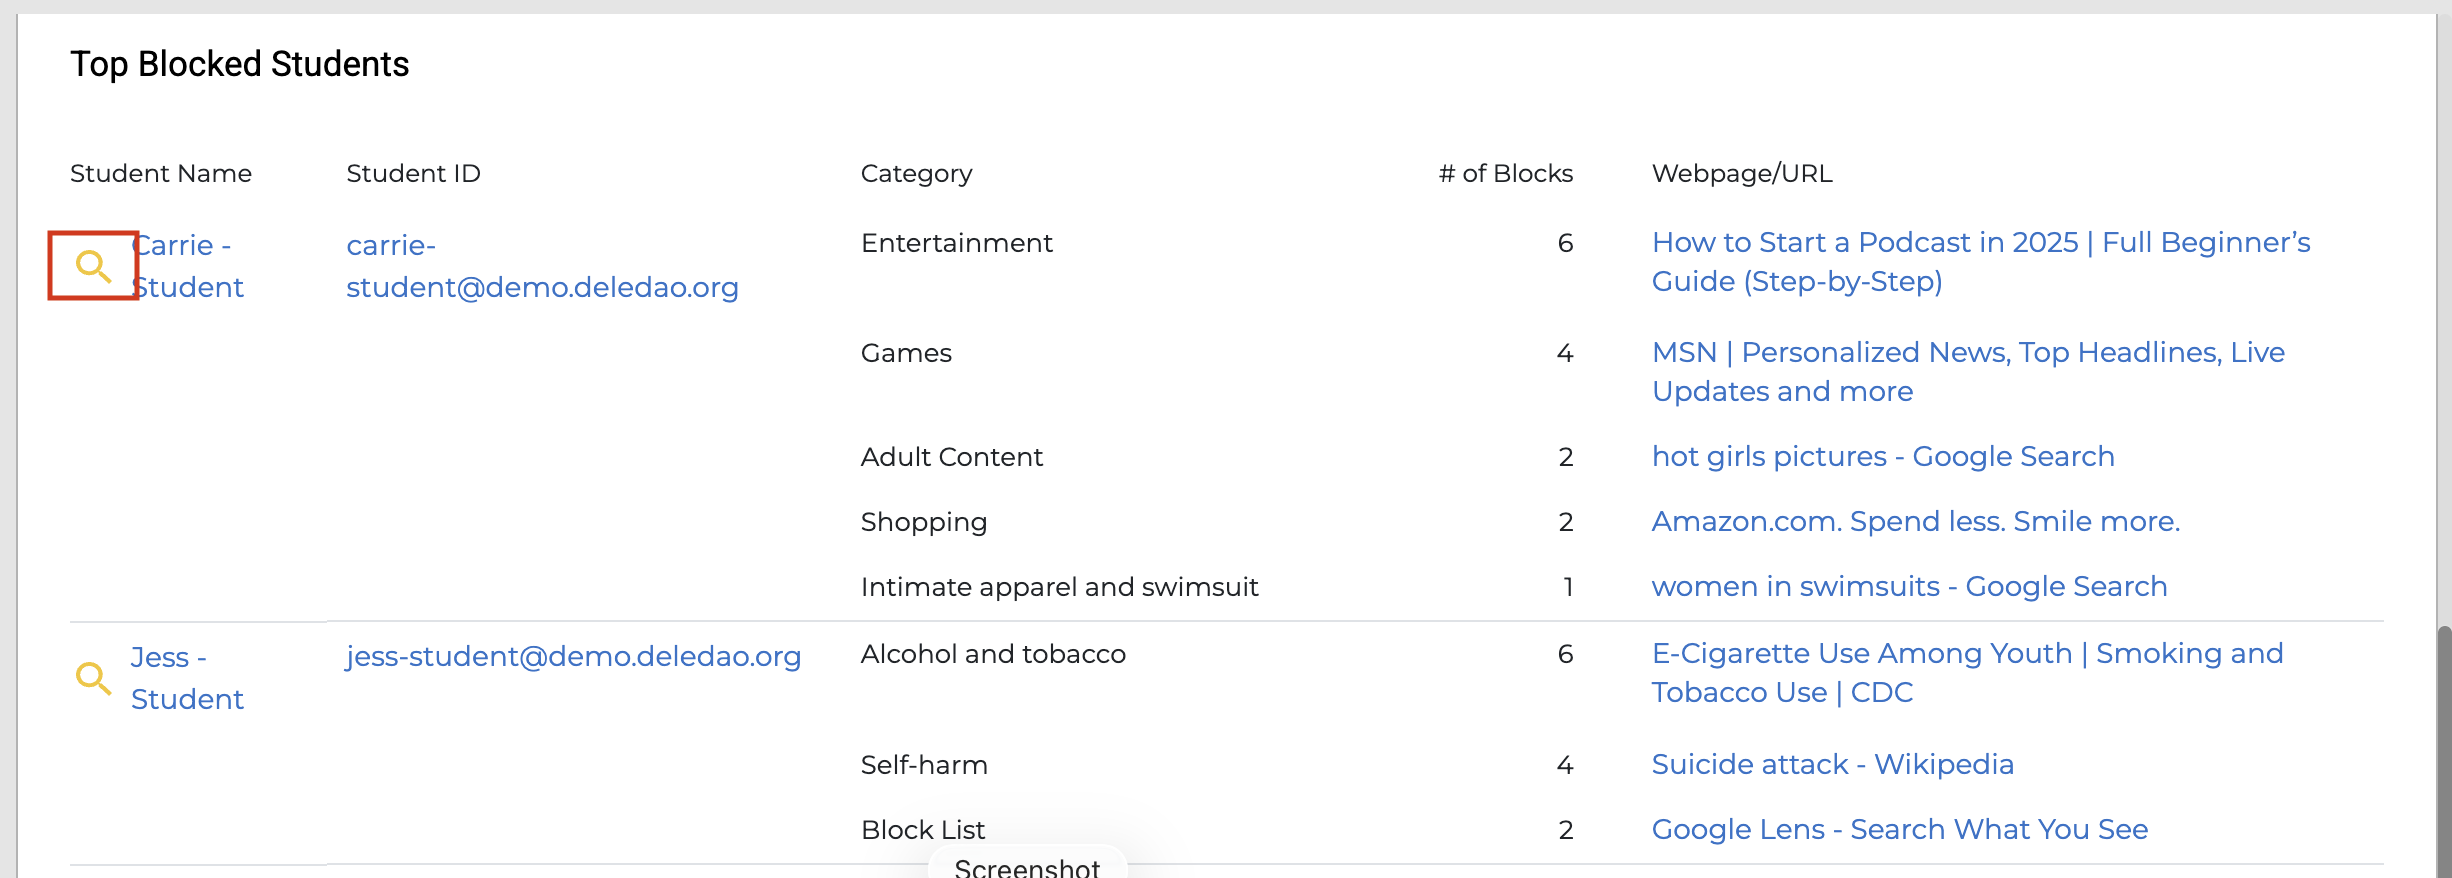
The Top 5 Blocked Students section helps administrators quickly identify students generating the most blocked activity.
For each student, the report displays:
- Student name
- Student ID or email address
- Blocked category
- Number of blocks
- Website or URL that triggered the block
View Detailed Student Activity
Click the magnifying glass icon next to a student to open the Reports page and automatically filter the results for that student.
This allows you to:
- Review the student's browsing activity
- Investigate blocked websites and categories
- View filtering events in greater detail
The magnifying glass shortcut provides a faster way to move from high-level dashboard data to detailed reporting without manually searching for the student.
Best Practices
- Review the Dashboard regularly to identify emerging browsing trends.
- Use category charts to investigate spikes in blocked or viewed content.
- Drill into reports when unusual activity appears in the trend graphs.
- Monitor the Top Blocked Students section to identify students who may need additional support or review.
- Use the magnifying glass shortcut to quickly investigate student activity without leaving the Dashboard.
This combination of dashboard metrics and detailed reporting provides a fast and efficient way to monitor web activity across your organization.
© Deledao Education